A total redesign of United Rentals's map feature, using real-time fleet visibility to provide actionable insights for better decision-making and improved operational control.
12+
MONTHS
6
STATUS LENSES
27+
pin variants

overview
As United Rentals's suite of digital tools evolved, its flagship worksite management platform Total Control was long overdue for a redesign. Despite playing a critical role in managing the largest fleet of construction rental equipment in the world, the platform had never been touched by experience design. The result was a clunky, unintuitive interface with a seriously steep learning curve.
Our team set out to completely transform the tool's user experience. My focus was on redesigning the live, interactive equipment map — a key feature that helps teams quickly visualize equipment distribution, monitor utilization, and make faster, more informed logistical decisions on their construction jobsites.
the problem
fragmented map experiences
Before the redesign, Total Control offered four separate map experiences, each with its own layout, features, and functionality. This lack of consistency made it difficult for users to develop a reliable mental model of how maps worked across the platform, leading to confusion, inefficiencies, and a poor user experience.
the design goals
1. overall usability
Improve usability of the existing map tool, improving UX and modernizing UI
2. surface key data
Visualize users' entire equipment fleet and associated jobsites. Provide ability to view key data and alerts at a glance. Track equipment location history
3. responsiveness & cross-pollination
Ensure users can effectively access and use the map in different parts of Total Control and different dimensions, designing for responsiveness and scalability


the solution
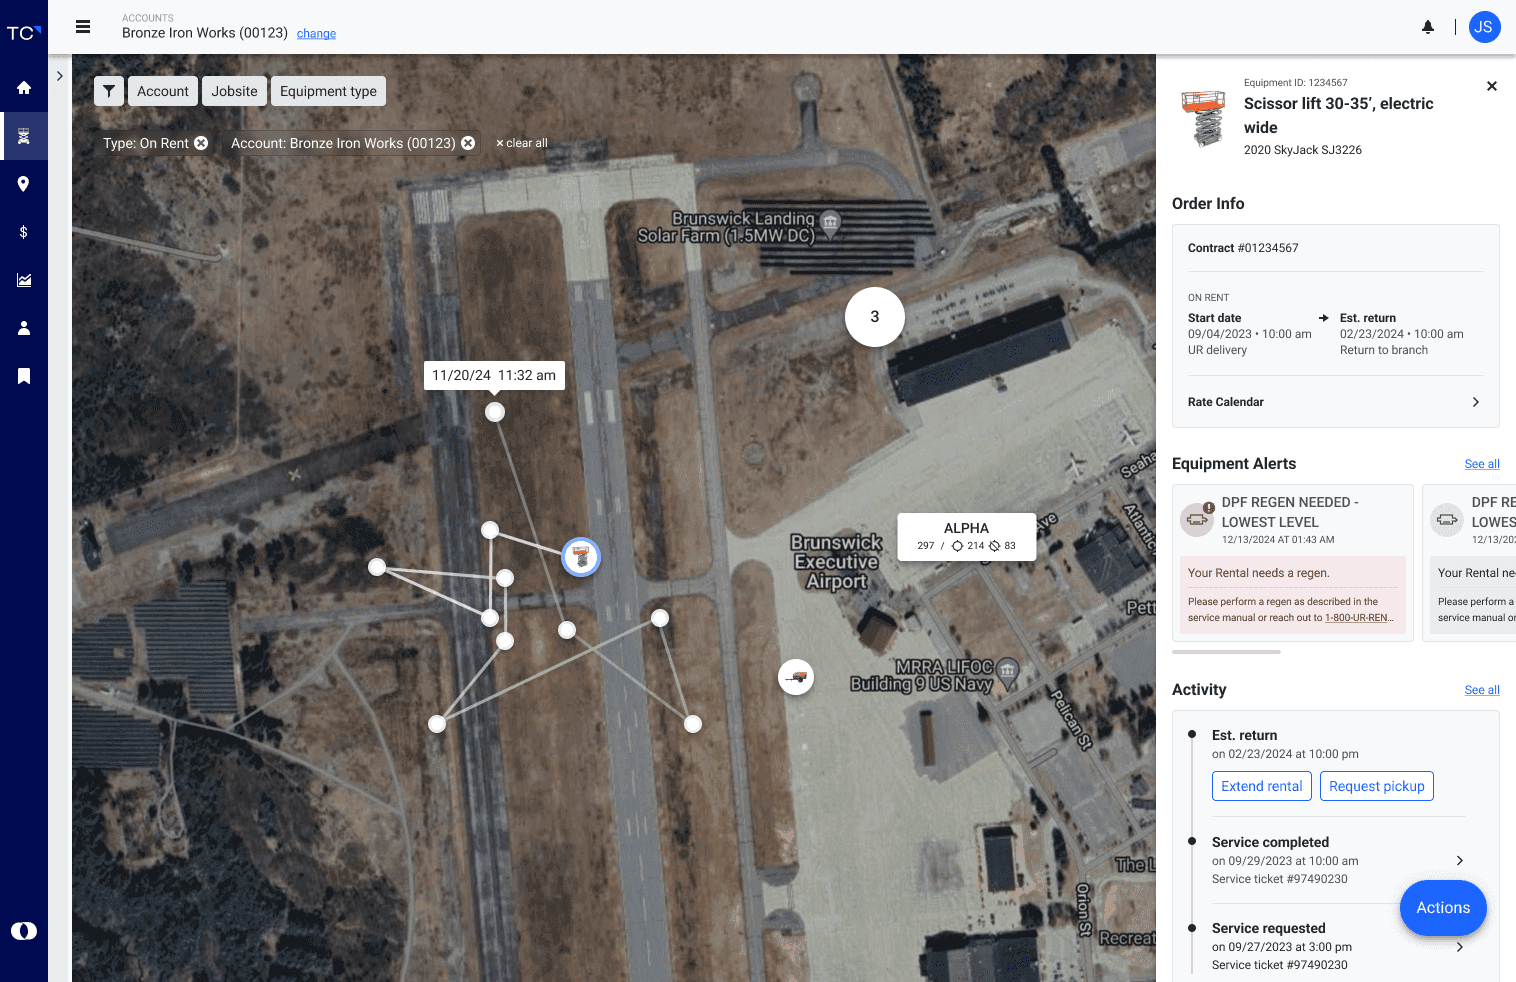
The redesigned map provides users with the ability to view critical equipment information at a glance.
I developed a visual language for distinguishing crucial information like equipment down-time, fuel and power level, and service statuses through color-coordinated map 'lenses'. Each lens breaks equipment down into several statuses, highlighting equipment in need of attention through eye-catching UI and iconography.
On a single click, equipment pins now also expand a summary card of information relevant to the selected lens. Not only improving the map experience for mobile and tablet users, this feature also allows users to pan across the map and assess the state of their fleet without breaking their flow.
Additionally, I developed the new ‘Geofence’ functionality, allowing users to draw boundaries around their equipment and their jobsites to better manage their fleets. I integrated Geofences throughout the map experience, ensuring they felt like a natural extension of jobsite management. I also fully designed the Geofence maintenance experience, adapting existing componentry from our design library.


As the final touch, I worked with product owners on compiling equipment alerts in one dedicated ‘Geofence Activity’ section, notifying users when equipment enters or exits a Geofence. As elsewhere in Total Control, I illustrated and incorporated construction-inspired empty states.

